Valentino Rota

Mar del Plata, ArgentinaOpen to roles in Buenos Aires or remote

All work

DSP2 + Reset GUI

Software that buys and sells online ad space automatically (a DSP/SSP platform), and the design system it shares with Analyzer. I led the security hardening that let the first outside client use it on its own.

Reset Digital, 2024 – now. Lead UI Developer (promoted). I lead one engineer and review their pull requests. Product UI, authorization, Reset GUI.

Next.js 14 (App Router), TypeScript, MUI, TanStack Table, Prisma, MySQL, next-auth, Storybook. Private codebase. Screens are Reset GUI components in Storybook, with mock data.

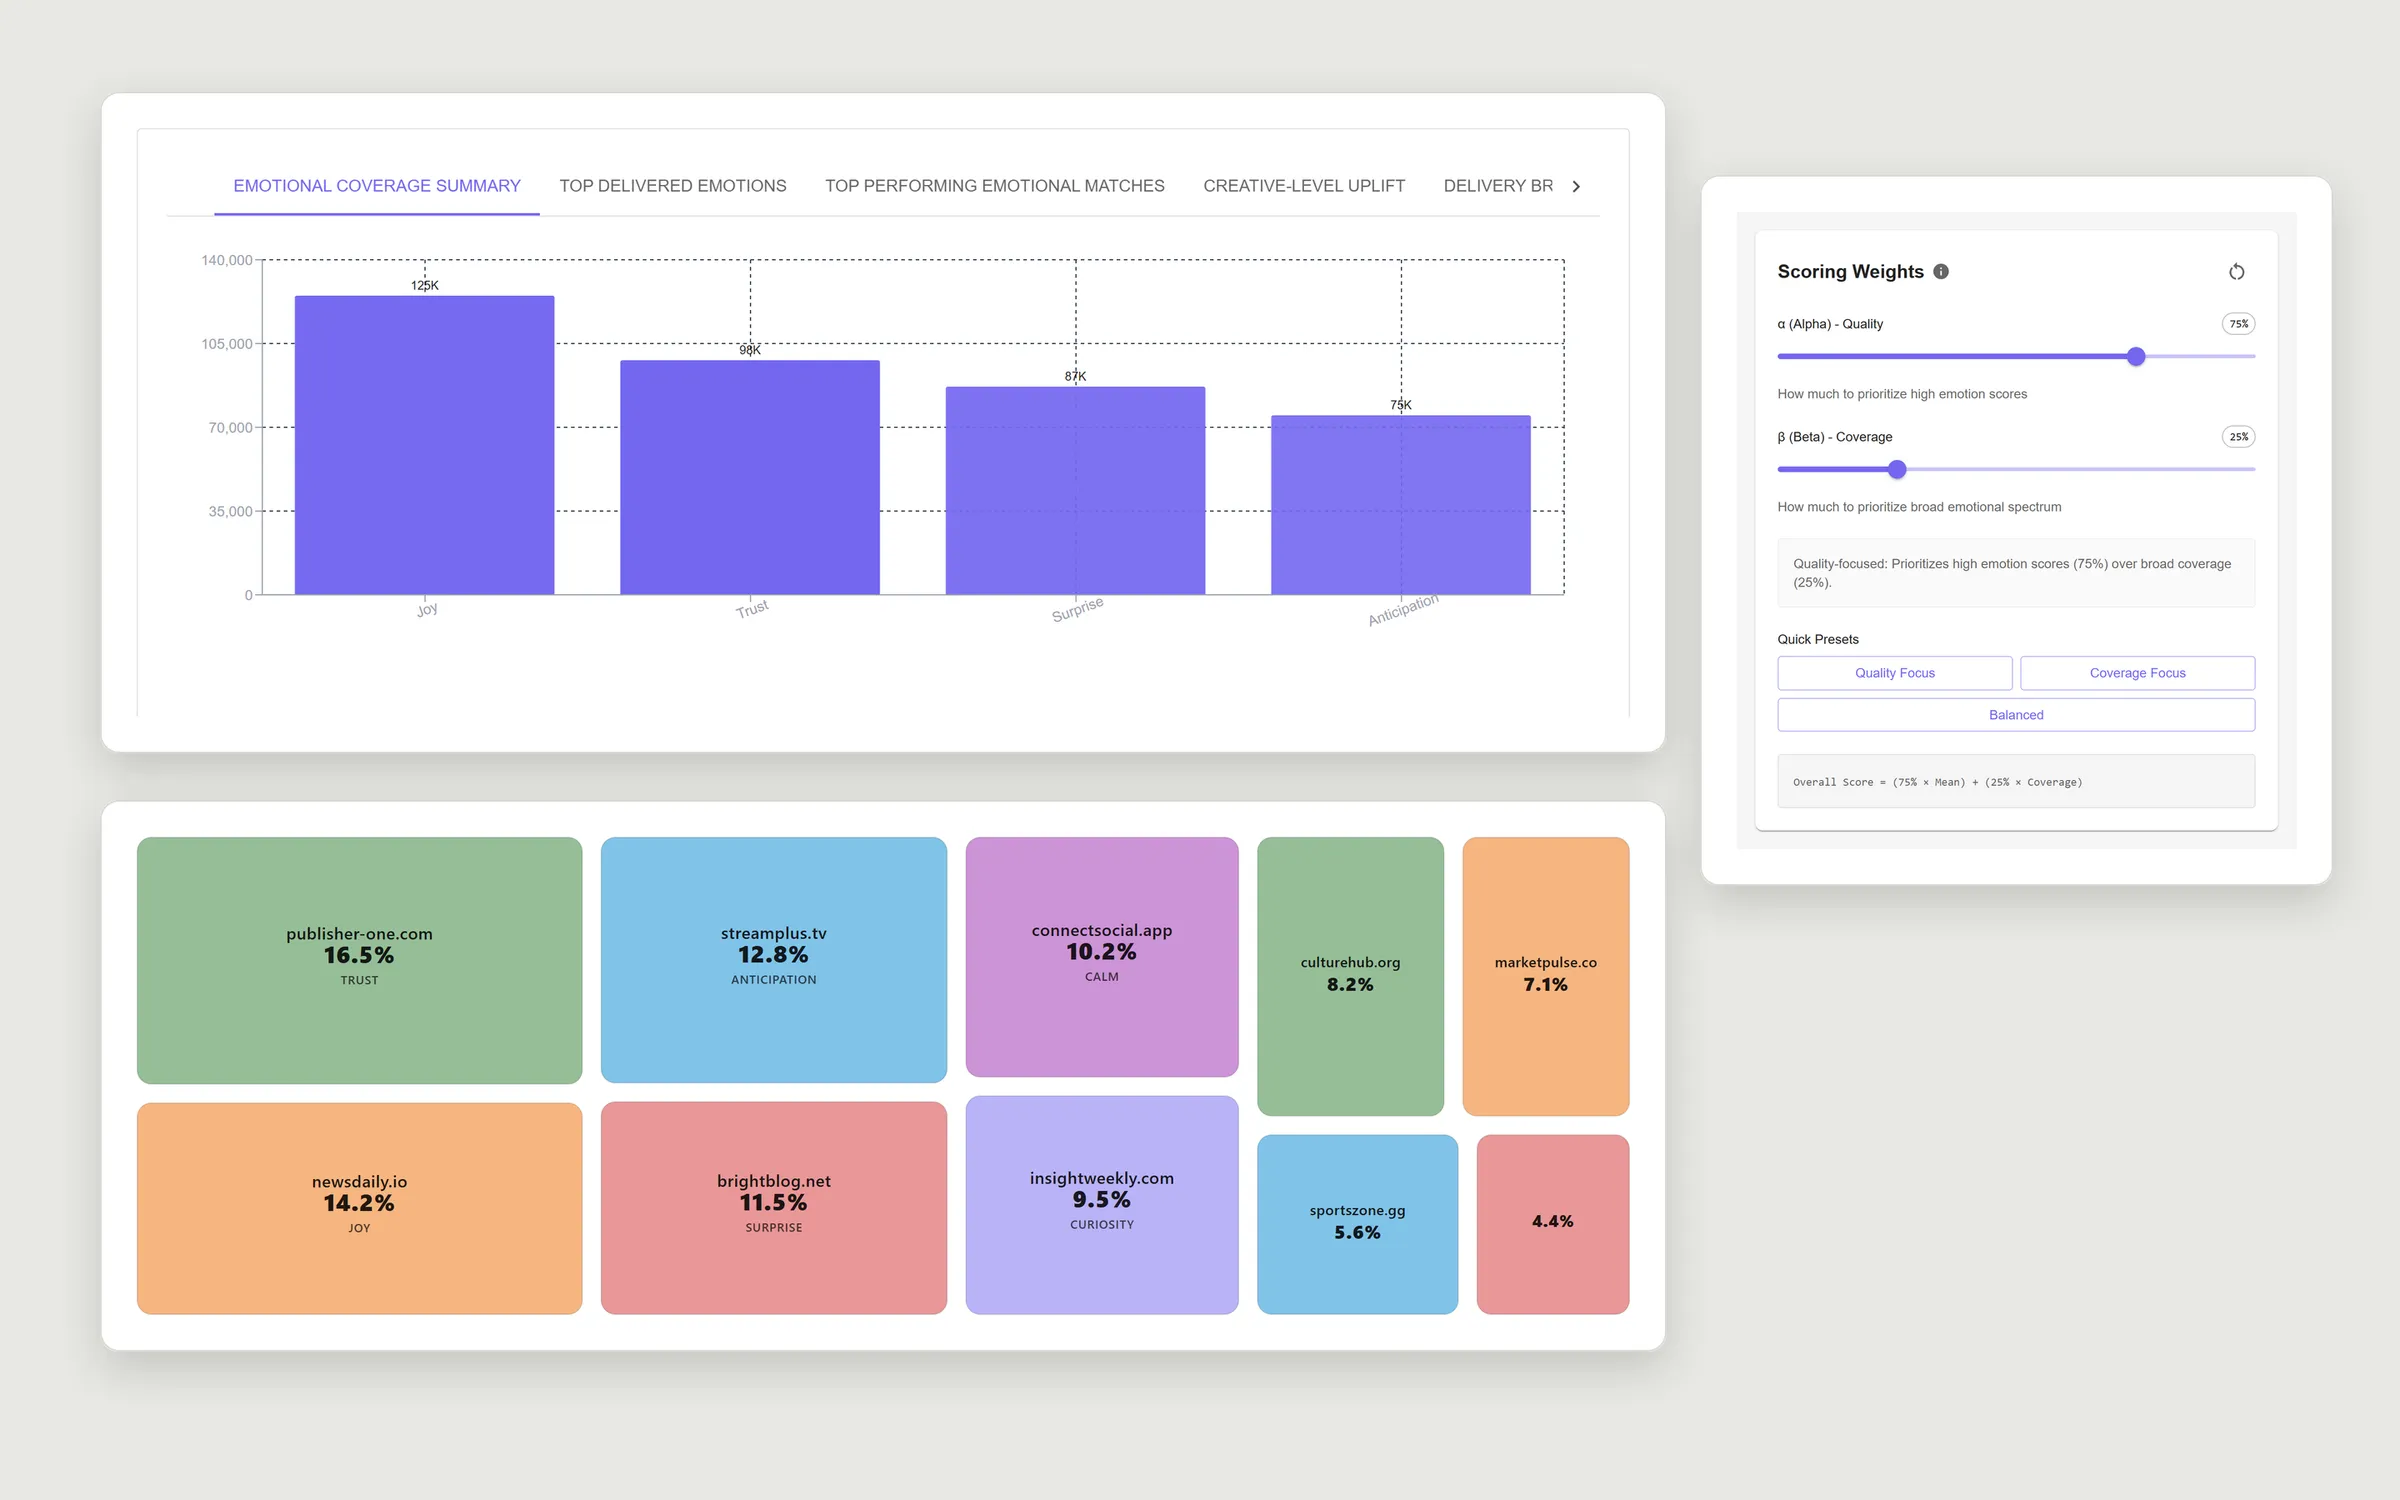
Reset GUI analytics components: emotional coverage bar chart, delivery treemap by domain and a scoring-weights panel
Reset GUI analytics components used in DSP2 (Storybook, mock data)
On this page
  1. Context
  2. My role
  3. Decisions
  4. Architecture
  5. Interface

Context

Reset Digital runs a programmatic advertising platform: advertisers buy ad space on websites through it, automatically. It has two products, DSP2 and Analyzer, and a design system both use.

Client users and internal staff use DSP2 for campaigns, site selection and reporting over tens of thousands of rows. In 2026 the platform opened to outside organizations logging in on their own. Before that day, the API had to be safe for people outside the company.

My role

I wrote the security review and the two-batch rollout plan. I split the code review into five areas by risk and assigned a reviewer to each; I took login and report scoping. I designed the authorization layer.

Day to day I lead one engineer: I review their pull requests and we have regular one-on-ones. I was promoted to Lead UI Developer over time.

Decisions

The hardening went out in two batches, around the launch.

Ship the hardening in two batches, by risk

The launch date was fixed. Instead of one release with everything, or a later launch, what a client could exploit on day one went first; what operations could cover for a few days went second.

Both batches shipped, with no incidents and no rollbacks.
No database migrations in the first batch

Rollback had to be a redeploy of the previous image, nothing more.

A 45-minute staging QA pass and an ordered deploy checklist. The rollback was never needed.

Authorization in one layer, not per route

Instead of checks written route by route, consistent enforcement: the same checks on every request.

Shared helpers that every handler calls for path ids, body ids and queries, with the integration suite testing cross-organization access over real HTTP.

One component library for two apps

Teams were duplicating the same table and form logic.

Instead of each app keeping its own tables and forms, DSP2 and Analyzer install Reset GUI from a private registry and render the same websites table, score filters and analytics tabs.

Architecture

Where the authorization layer sits. Simplified.

Interface

I designed and built these screens; the colour and type theme is the team’s.

The score, printed on the badge

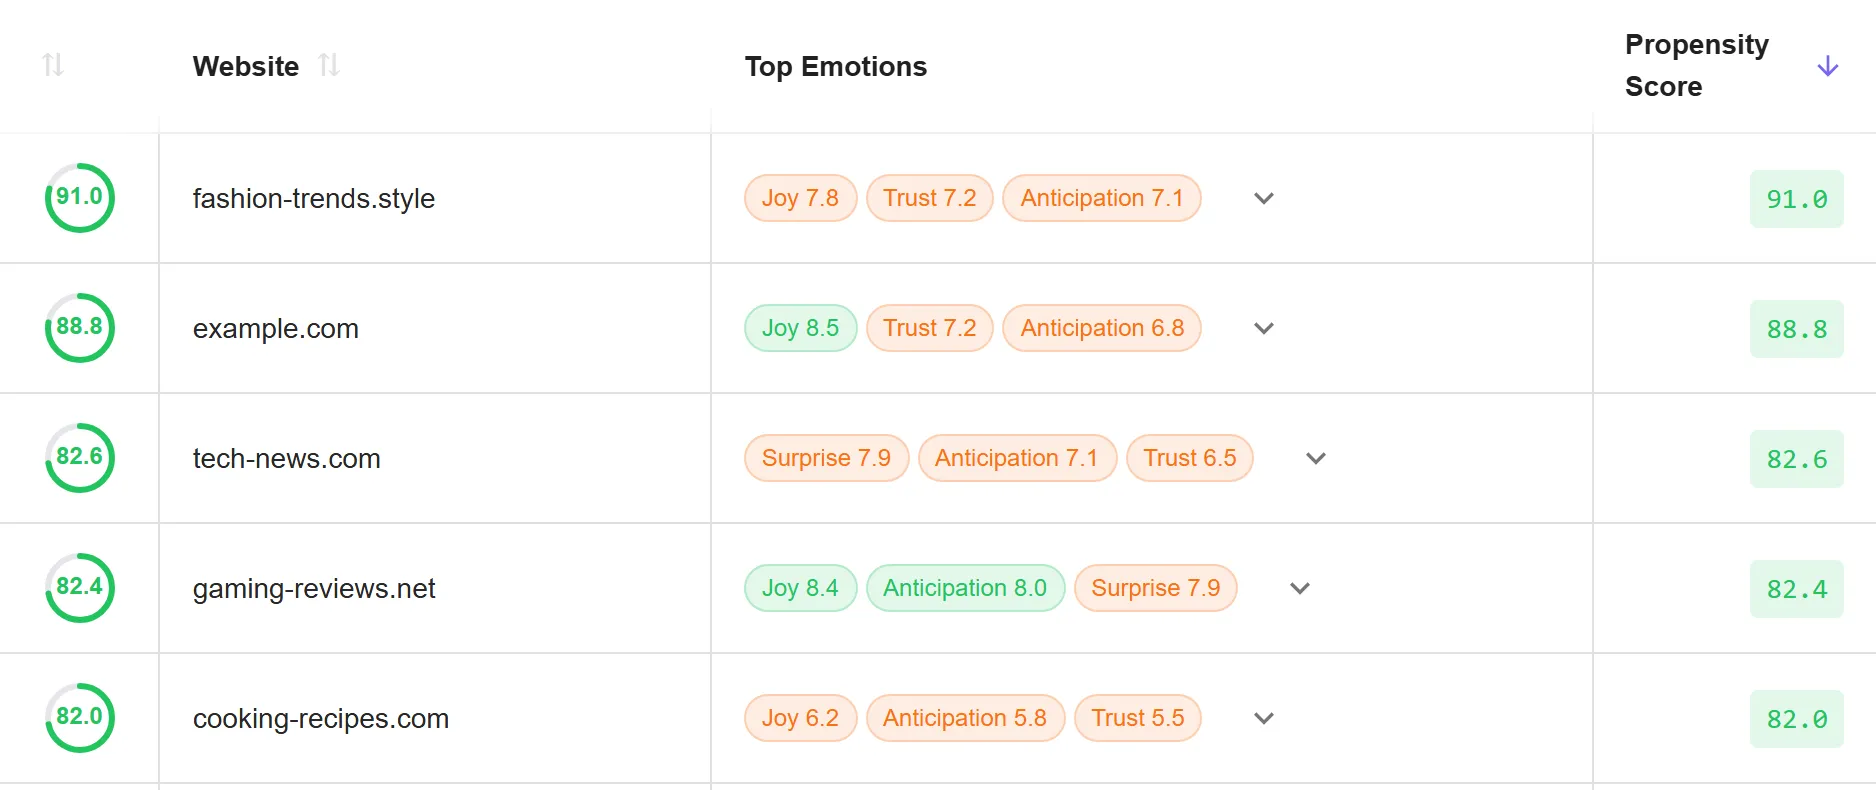
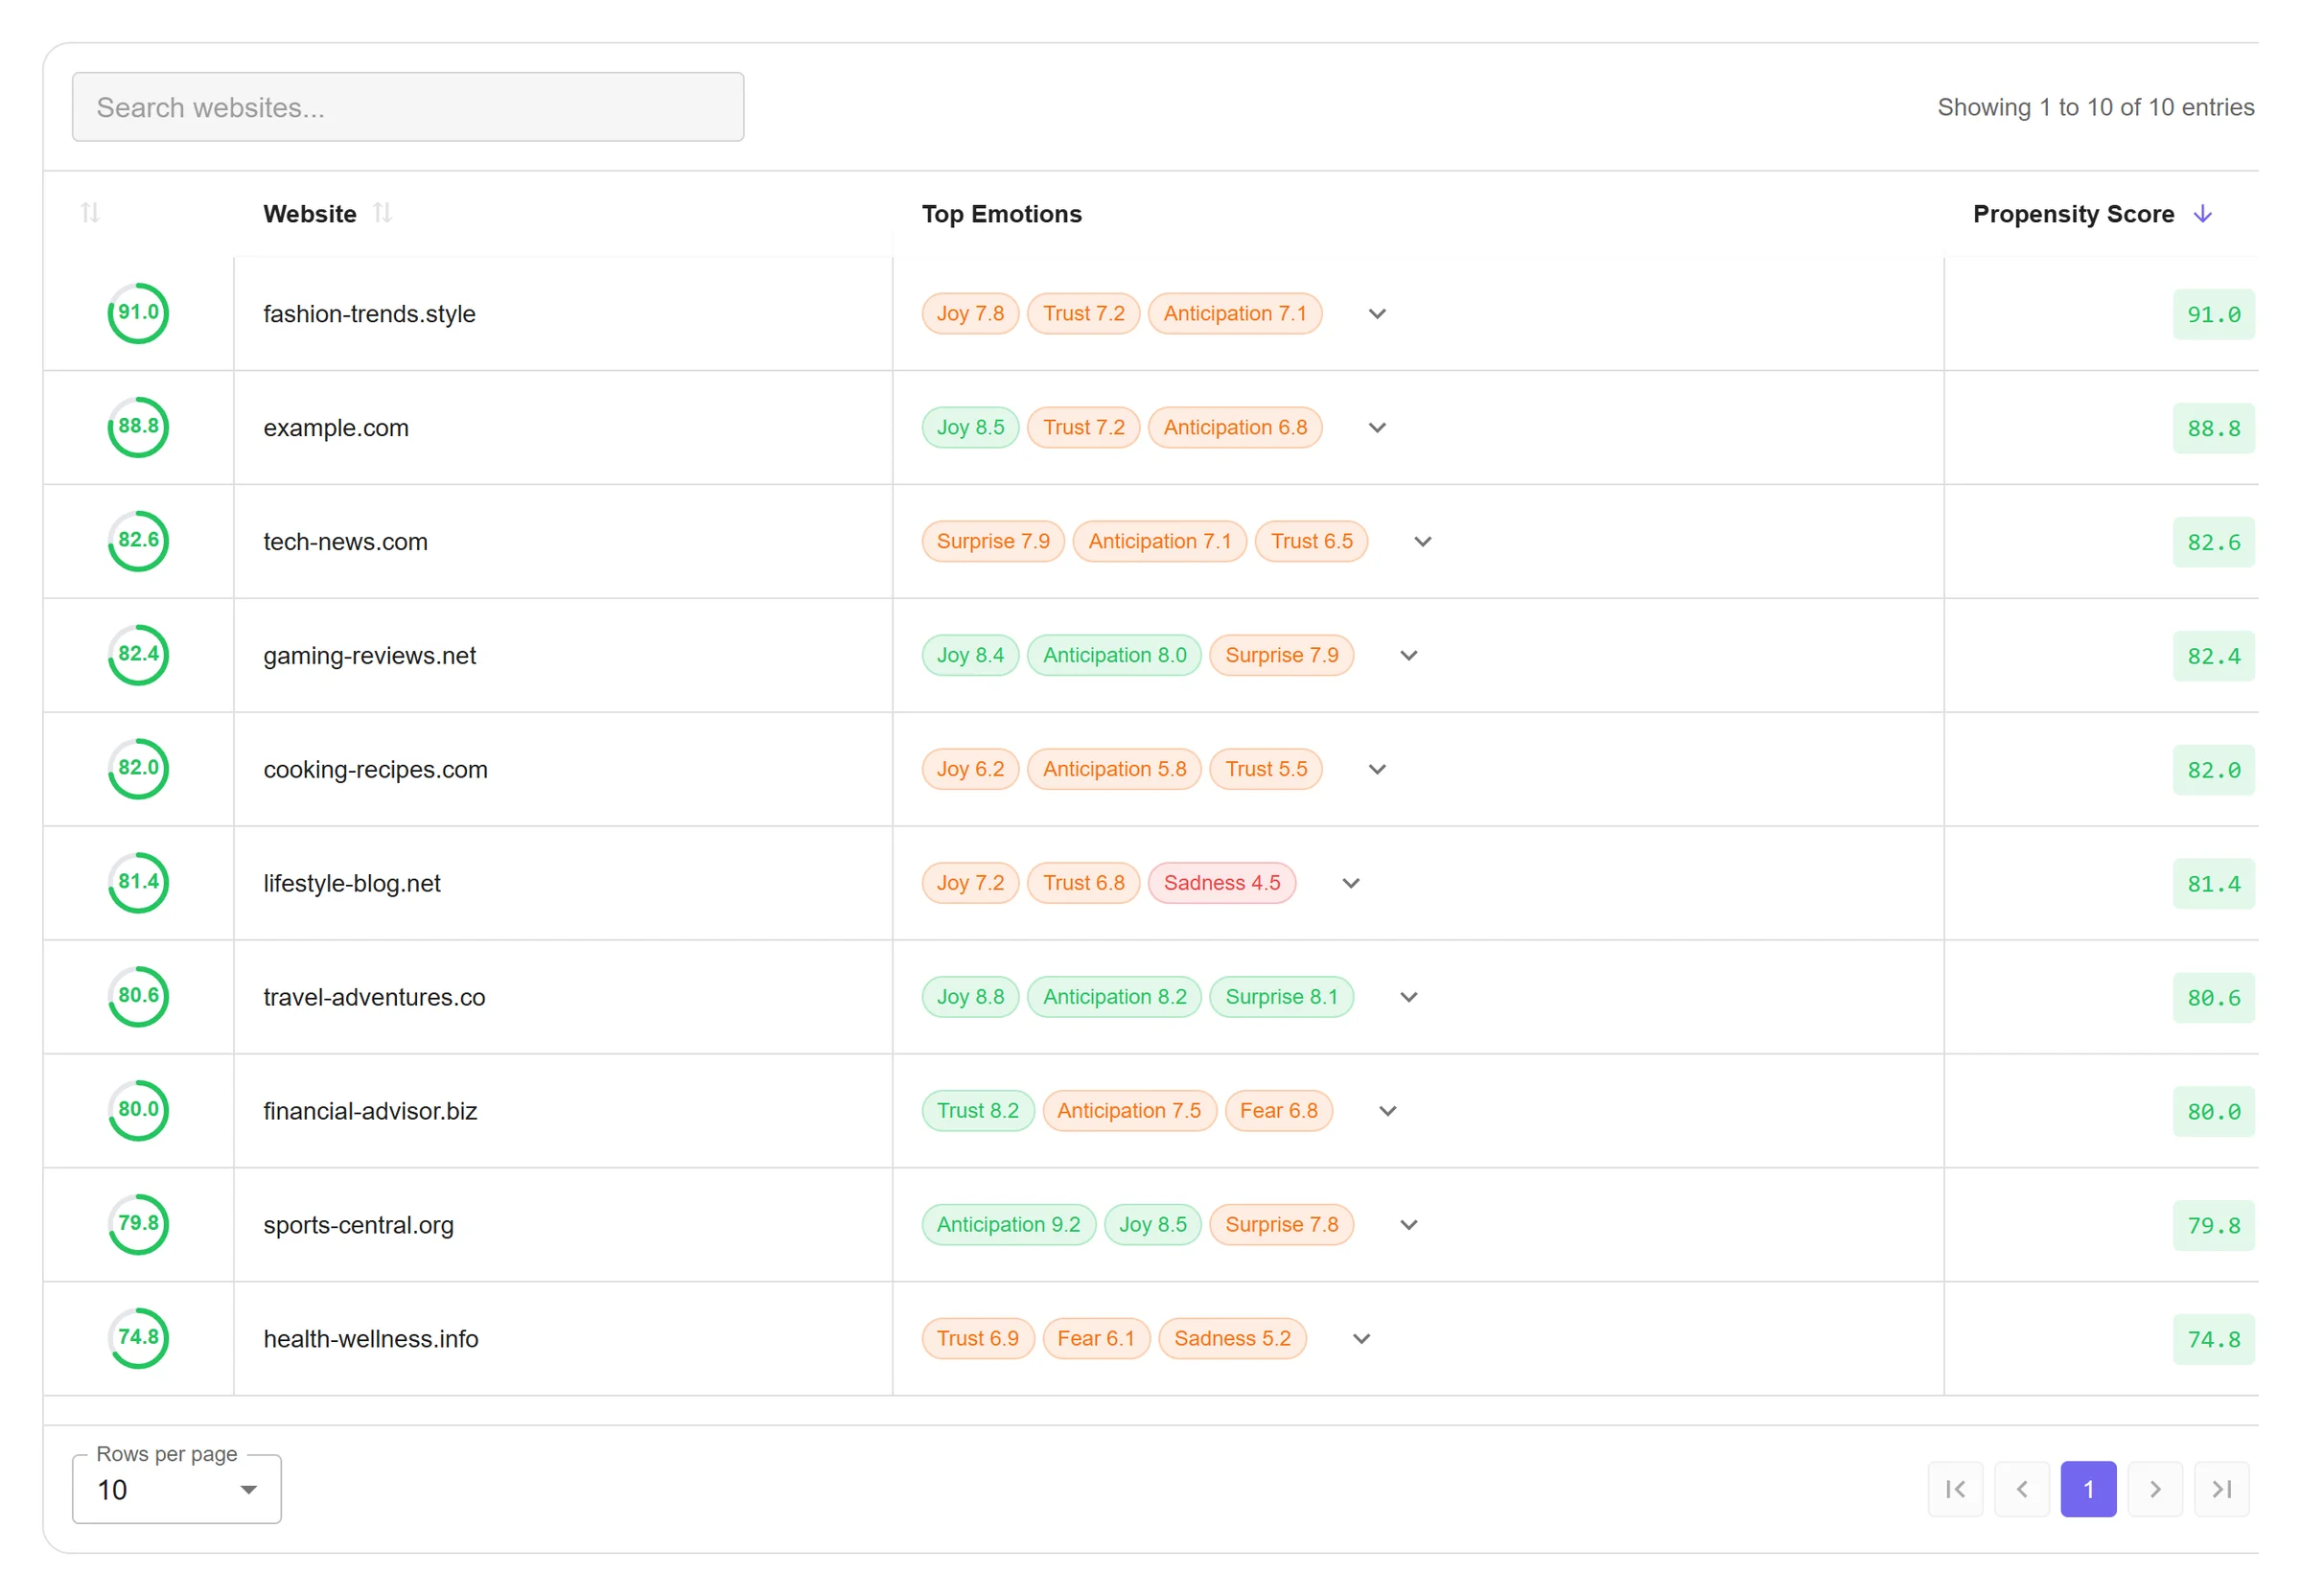
The badge colour encodes the emotion’s score in three bands and nothing said so: the same emotion came out green on one row and orange on the next, and the whole column read as random. The number was only in the hover tooltip, one badge at a time, which is no use when scanning a table. Printing it beside the name makes the colour self-explanatory and needs no legend.

Websites table, top emotions column: badges with only the emotion name, Joy green on one row and orange on the next
Before: colour only
The same rows with the score printed on each badge, such as Joy 8.5 in green and Joy 7.8 in orange
After: the score on the badge

Sorting by two columns, made visible

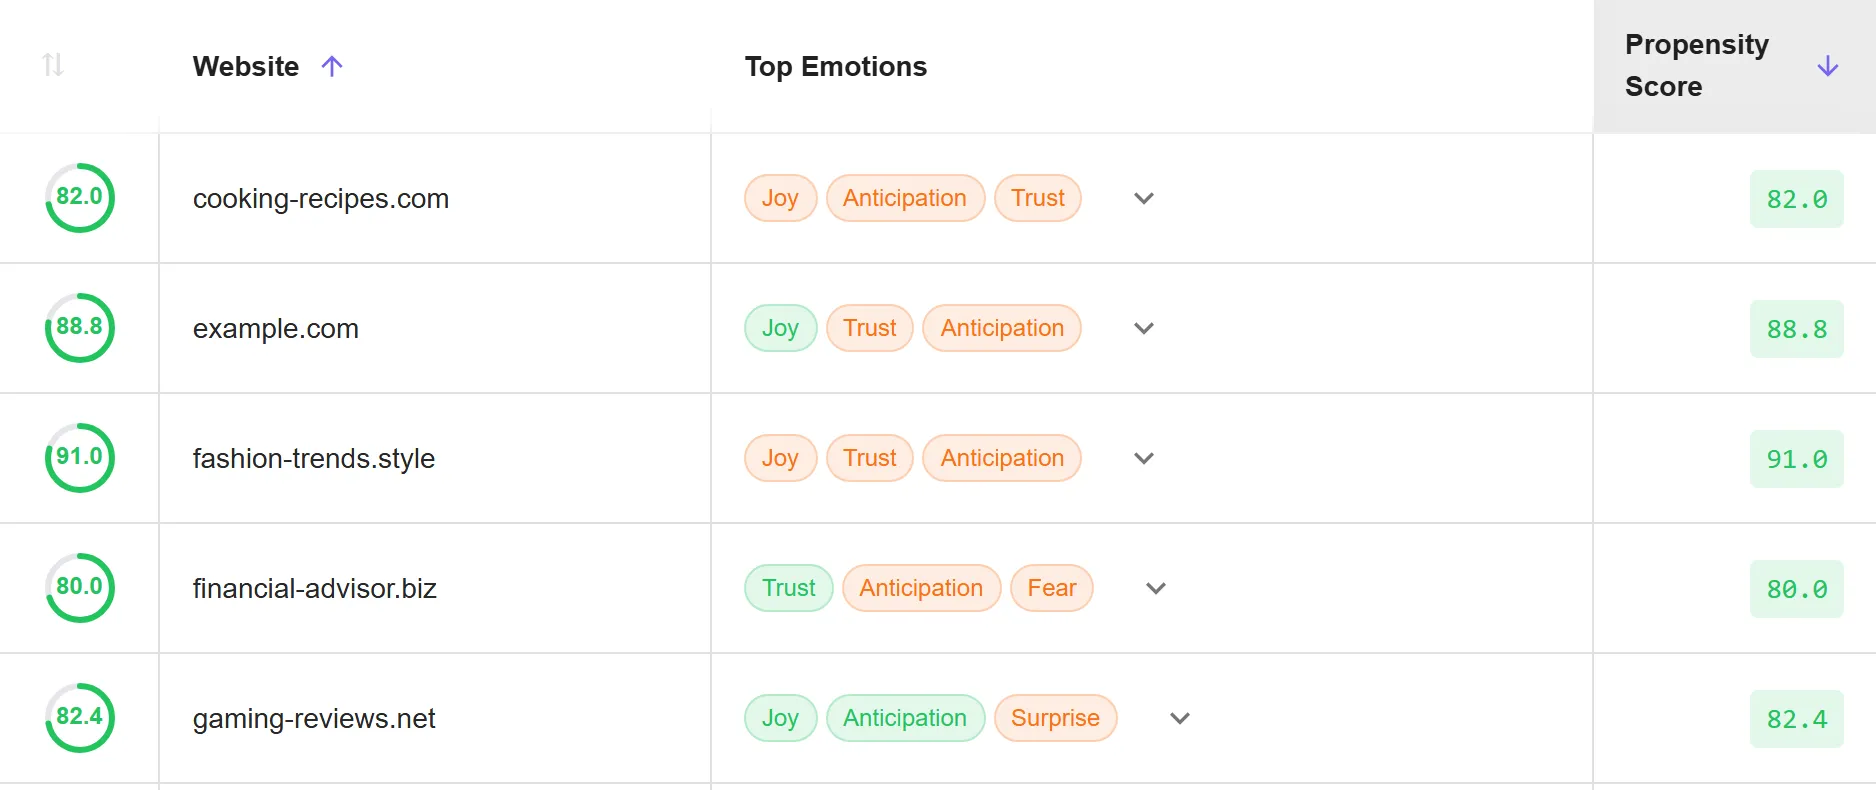
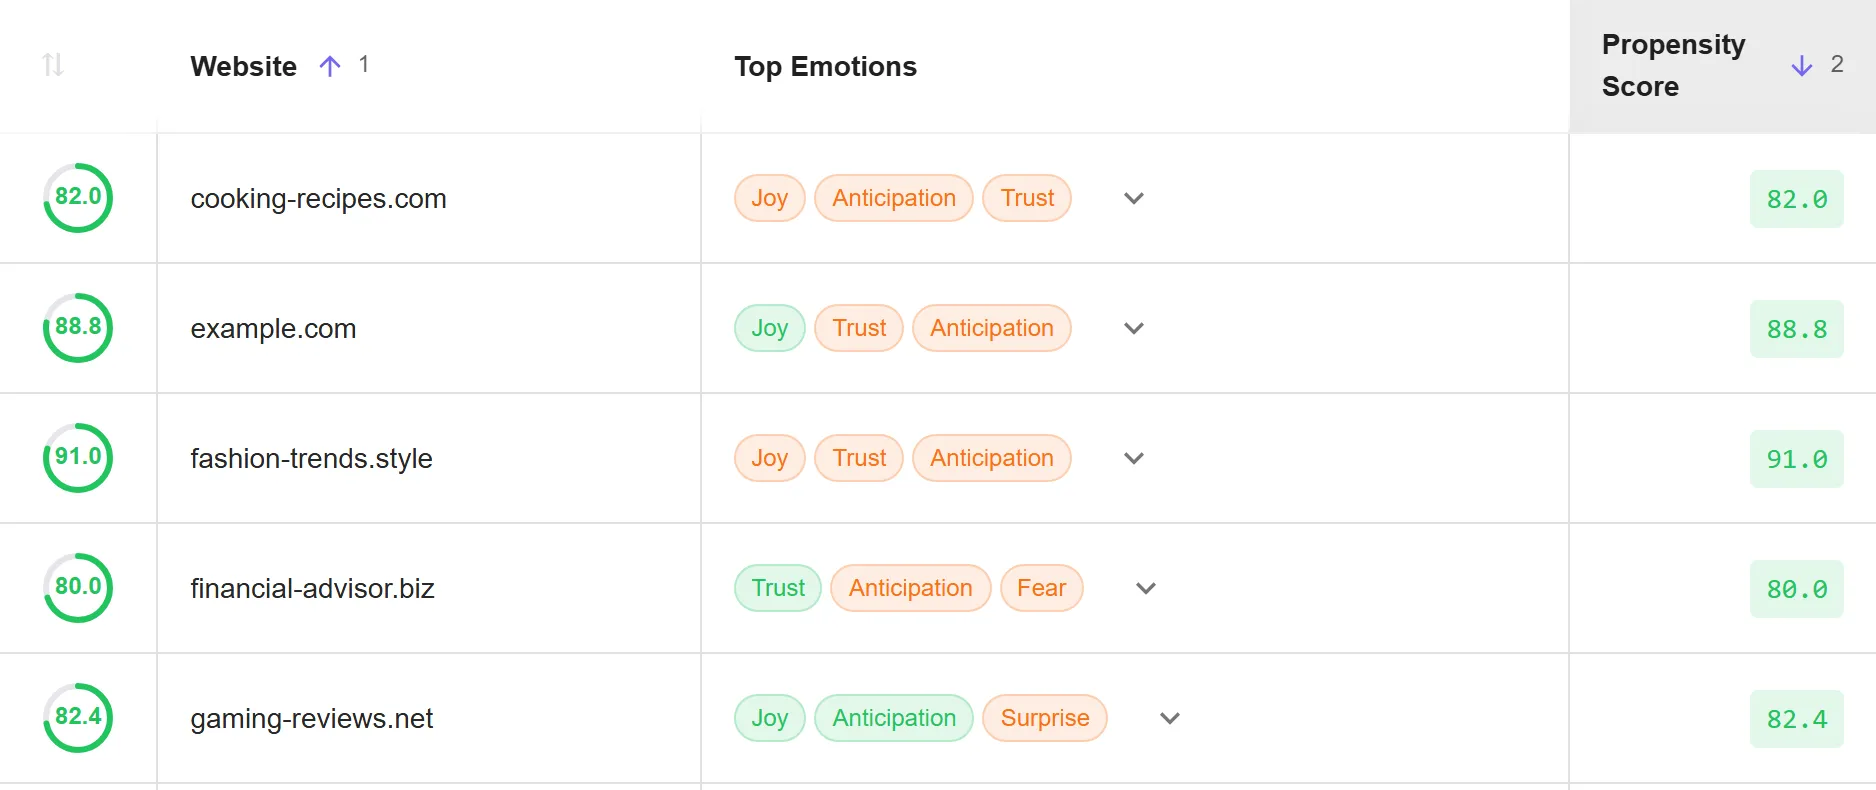
A planner needs to rank by propensity score together with CTR or avails, not one at a time. Shift-click already added a second column to the sort, but nothing showed that it had joined or in what order the columns applied. A header now shows its position in the sort once more than one column takes part.

Websites table sorted by website and by propensity score: both headers show an arrow and nothing else
Before: no sign of a second sort column
The same table with a 1 beside the website arrow and a 2 beside the propensity score arrow
After: rank beside each arrow

Colour that carries data

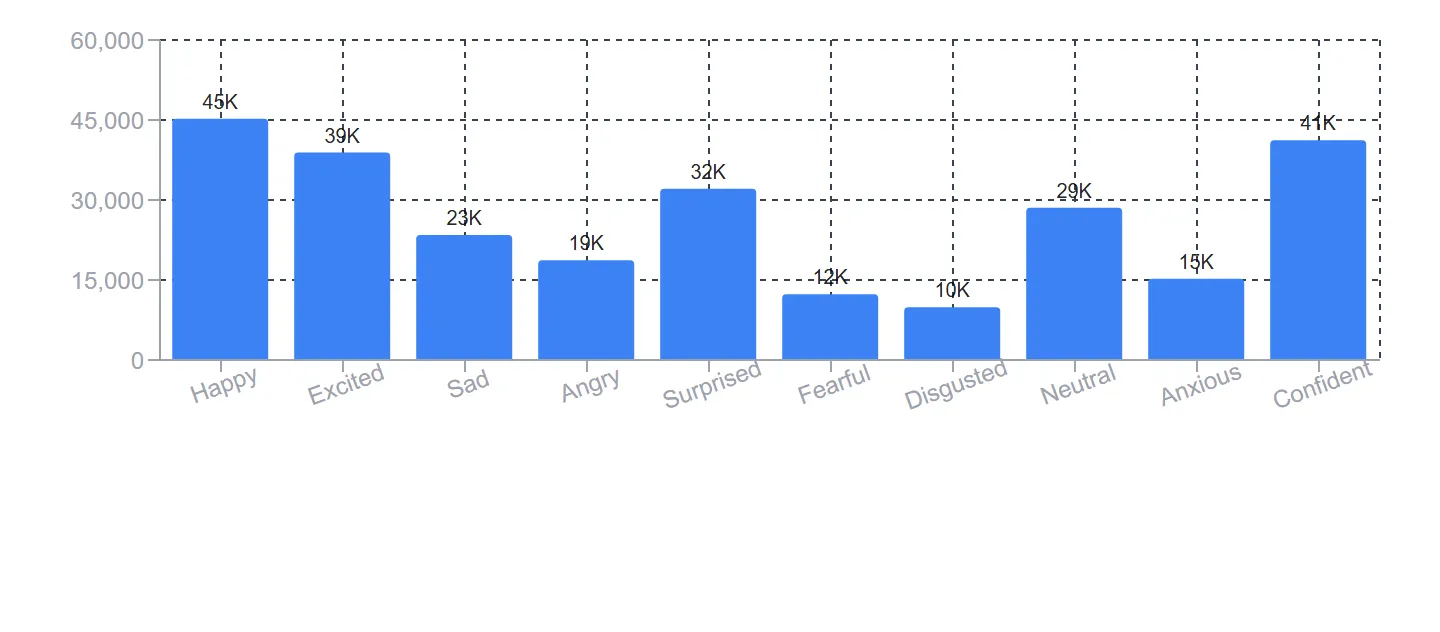
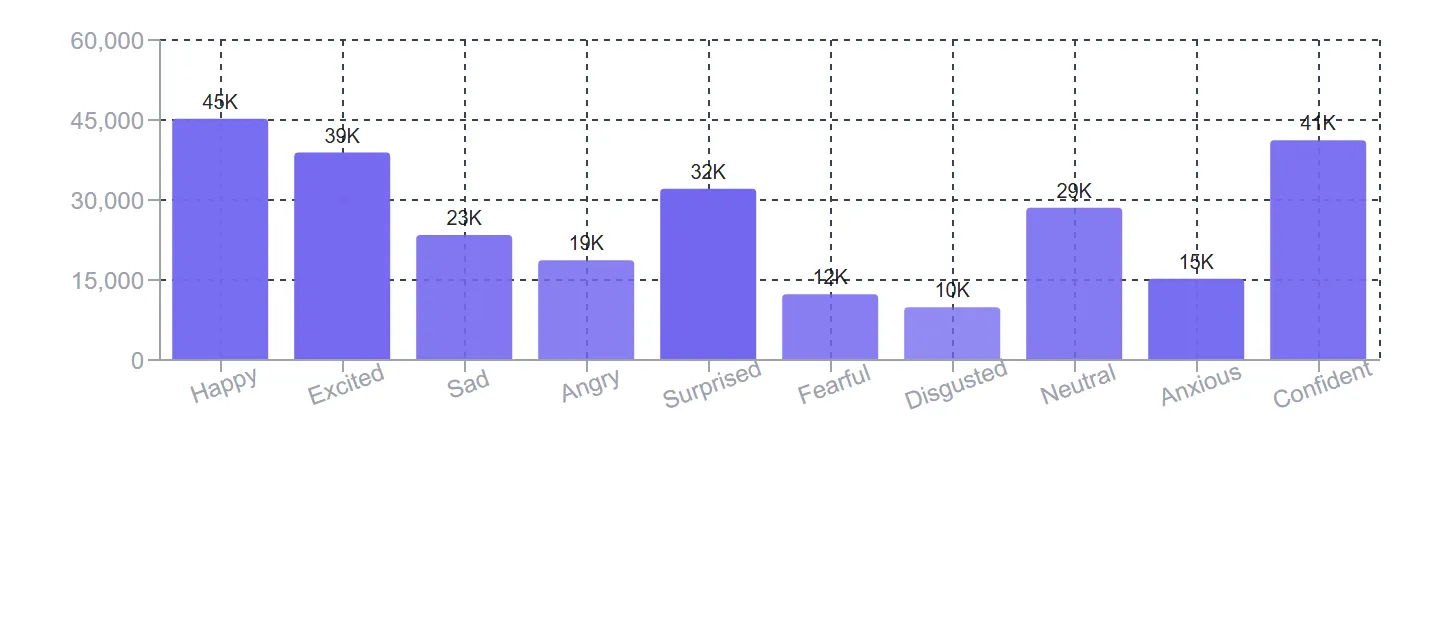
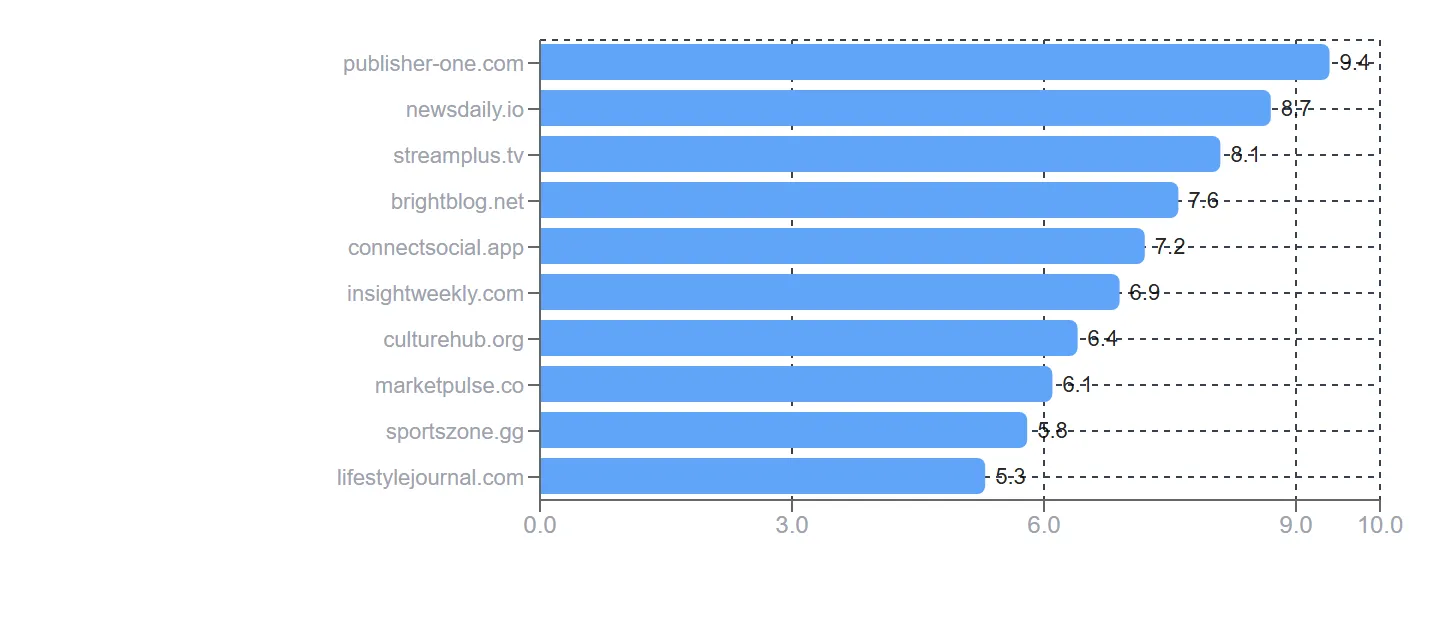
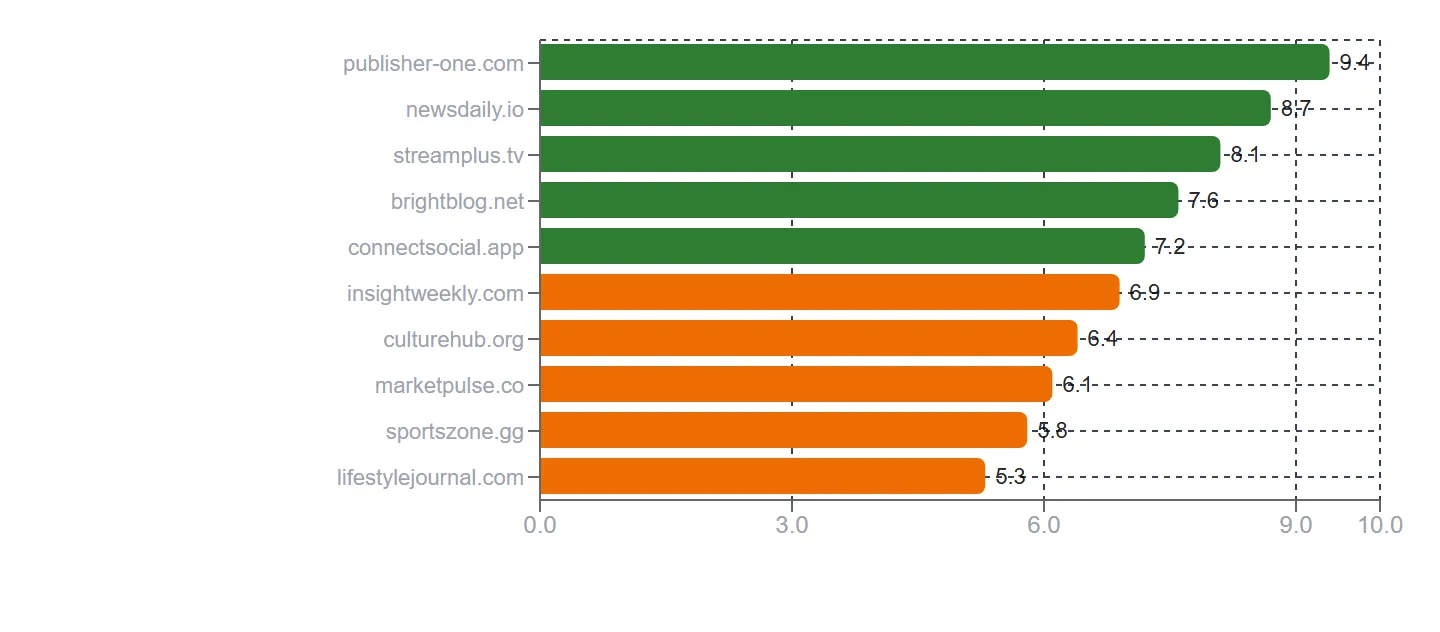
Every bar was drawn in the same blue, which left the charts saying nothing the height was not already saying. The spec asked for darker bars at higher CTR, so a short bar that converted well still reads as one. Shading runs against the highest CTR on screen rather than a fixed scale: rates differ by an order of magnitude between campaigns, and a fixed scale would flatten most of them into one tone. Match strength uses the bands the propensity filter already states in its own tooltip, which keeps one definition of a strong match rather than inventing a second.

Bar chart of ten emotions, from 10K to 45K, every bar the same blue
Before: flat blue
The same chart with each bar in a lighter or darker violet, so bars of similar height differ in tone
After: tone by CTR
Horizontal bar chart of ten websites, from 9.4 down to 5.3, every bar the same blue
Before: flat blue
The same chart with the bars from 9.4 to 7.2 in green and those from 6.9 to 5.3 in orange
After: bands by strength
Scoring weights: the sentence and the formula rewrite themselves as the sliders move.

Reporting tables sort, filter and paginate on the server, because they run over tens of thousands of rows and have to export them.

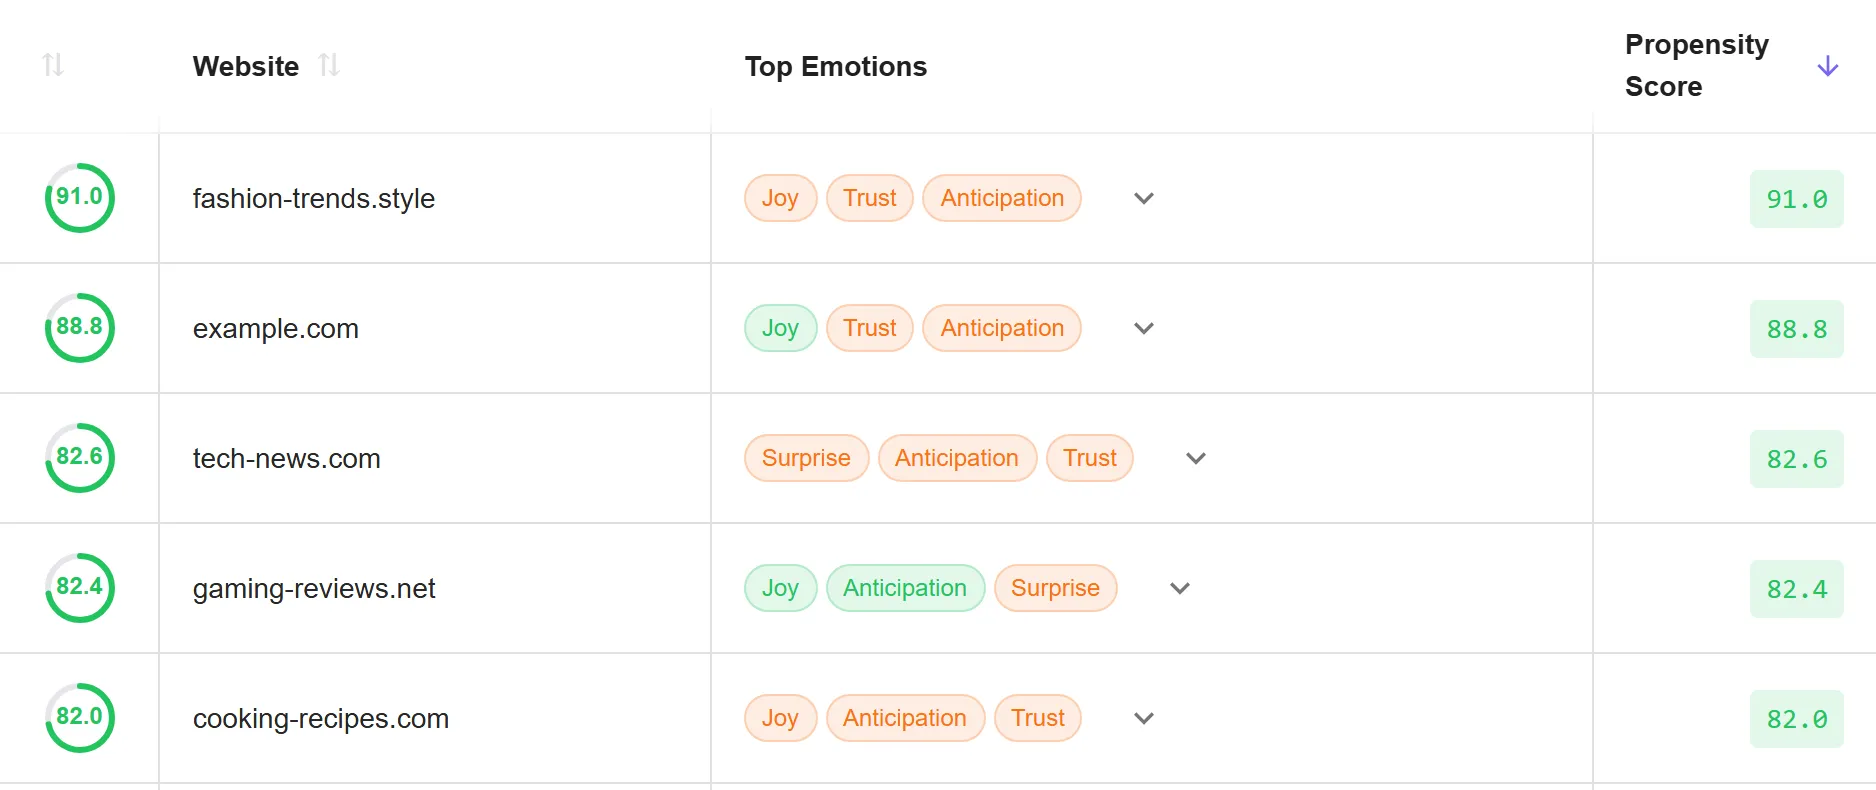
Websites table with search, top emotions per site and a sortable propensity score column, paginated
Websites table: search, sort and pagination
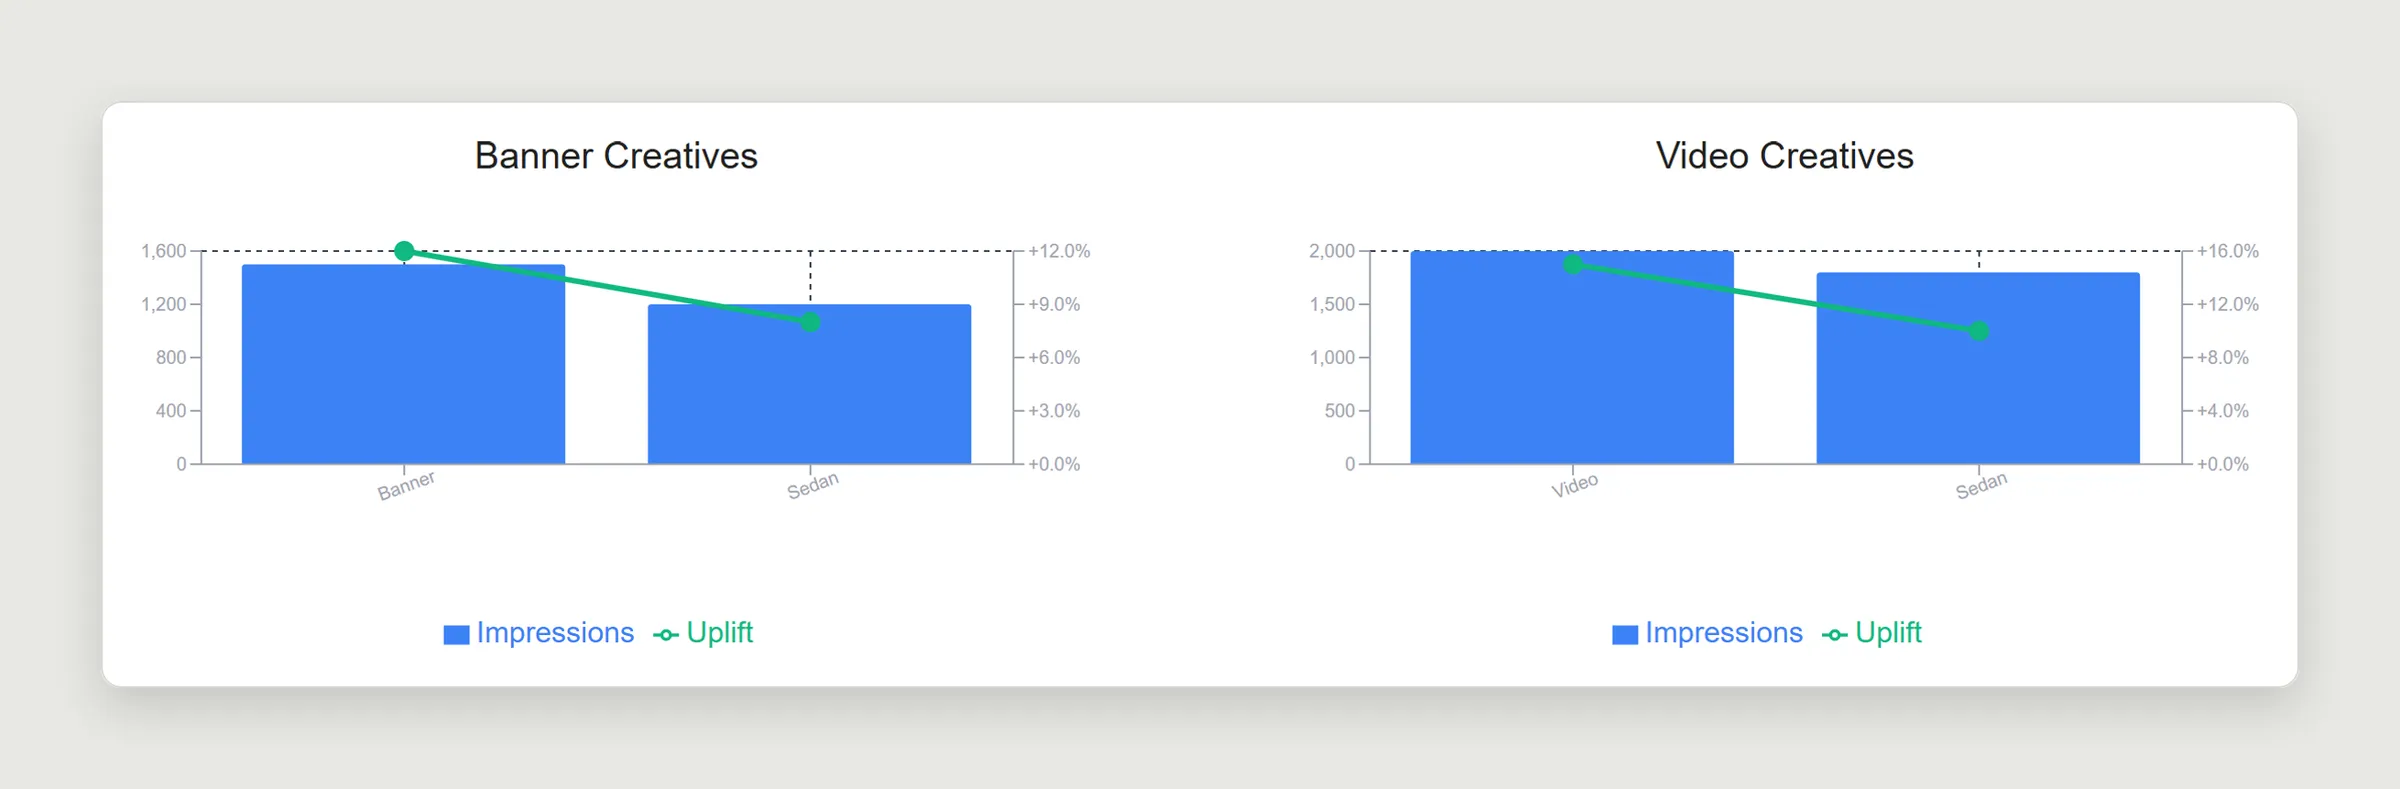
Creative-level uplift: impressions as bars and uplift as a line, for banner and video creatives
Creative-level uplift
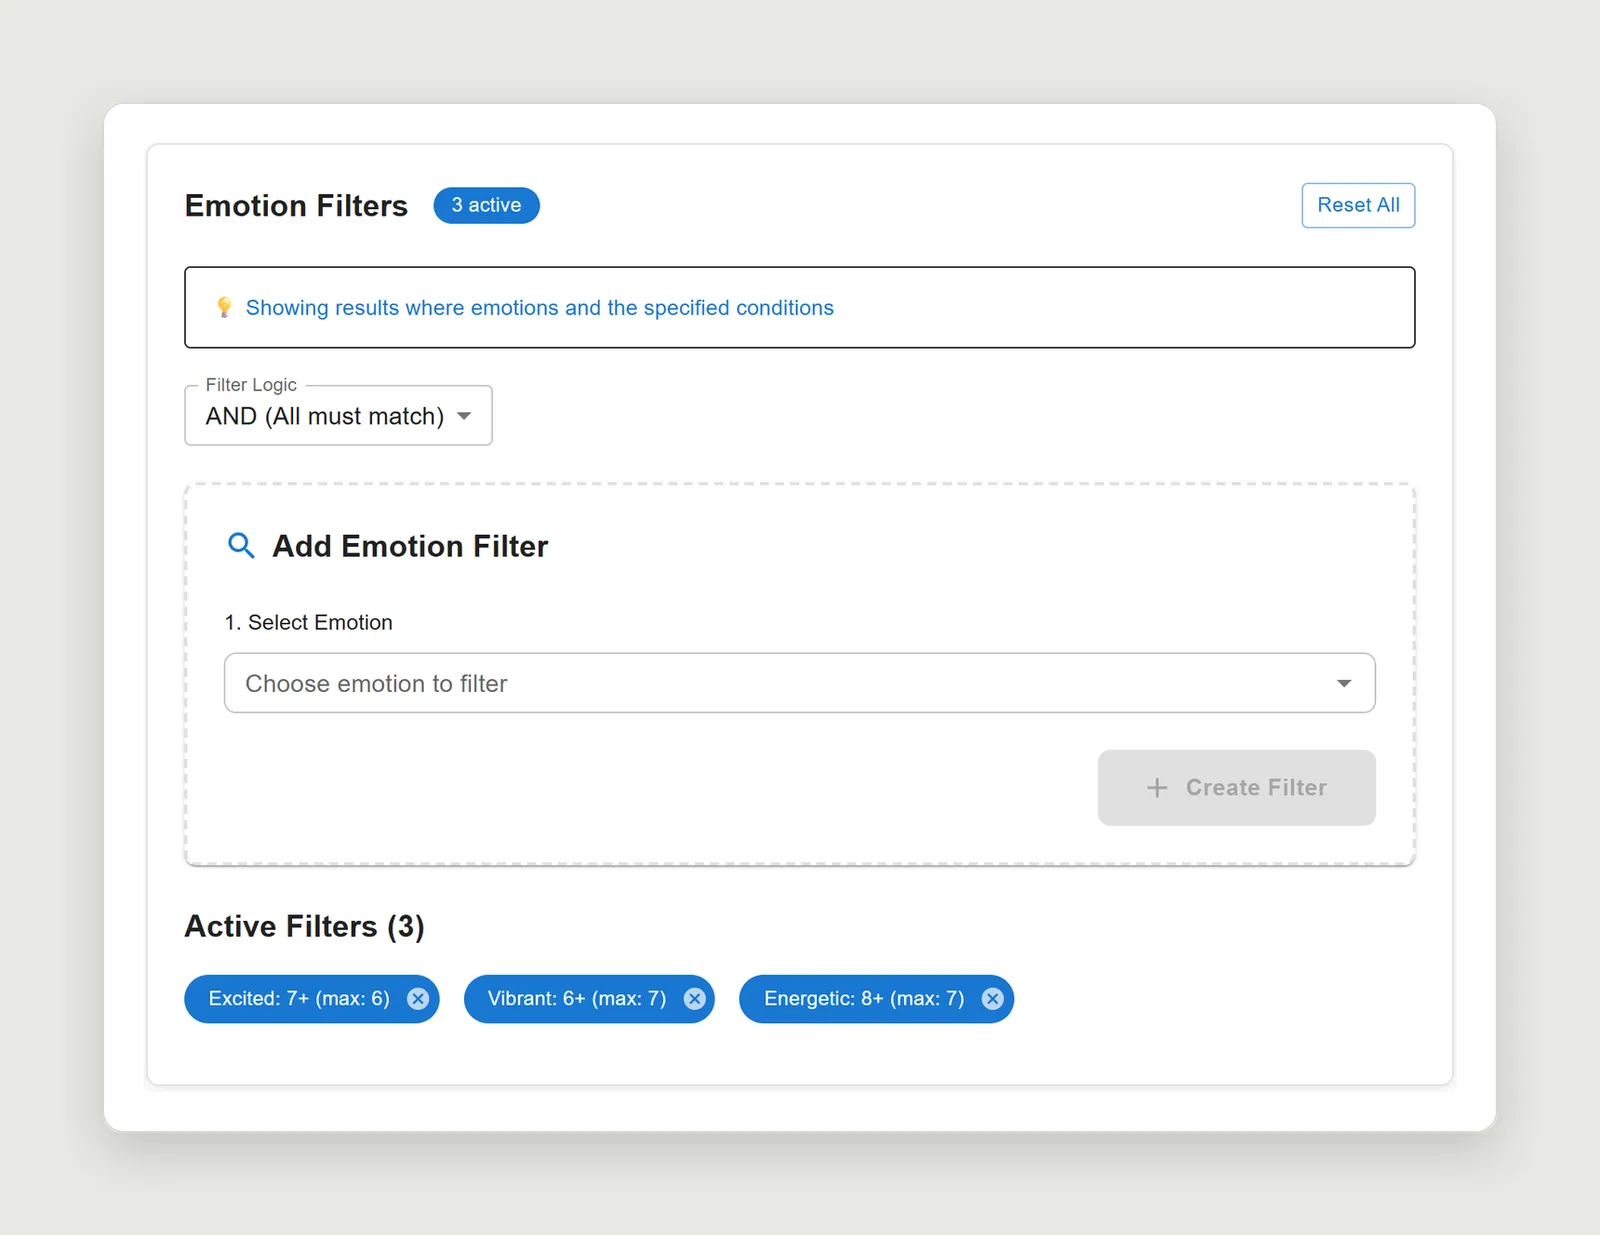
Emotion filter builder with AND logic and three active filters
Emotion filter builder

Contact

Open to design engineering and full-stack roles, in Buenos Aires or remote (UTC−3). Spanish (native), English (professional, spoken and written).

valentino.rota3@gmail.com

Next: Analyzer